The Ideal Data Analytics Method

Section 1: Design Better Questions
Robert Peng explains why he reads John Tukey's paper on The Future of Data Analysis every year and every time he reads it, he finds a different outcome and learning. He shares a spectacular line in the paper saying:
Far better an approximate answer to the right question, which is often vague, than an exact answer to the wrong question, which can always be made precise.
That is so right! For designing a robust analytical design and method, the question definition should be right. If not spot on, it should at least come close to the business problem we are trying to address. In my experience, we often solve wrong problems and find the right solutions which are spectacular in design. However, does that design solve the actual problem at hand? Robert also shared an amazing figure defining the exact state of affairs in the analytics industry regarding quality of question design.

As shown in figure above, statistics and machine learning are secondary to the quality of the questions. Optimal state is reached when quality of question design is significantly improved, right data engineering is applied on data and then the right (not the most fancy) data analytics method is applied, it can lead to optimal solutions.
In his book, Future of Data Analysis, John W. Tukey explains whether we will be able to overcome real difficulties and really help science and technology through analytics? He says:
"That remains to us, to our willingness to take up the rocky road of real problems in preference to the smooth road of unreal assumptions, arbitrary criteria, and abstract results without real attachments."
Section 2: Analytics frameworks
Next topic I want to touch upon is - how to think of an analytics method or procedure? How do we pursue an analytics project? What are the steps?
Well, there are often ambiguous steps dependent upon the type of problem we want to solve. However, there are solutions which can help reach our conclusions in a better and smooth way. Let us look at some of the analytics frameworks.
- CRISP-DM - below diagram should be self explanatory
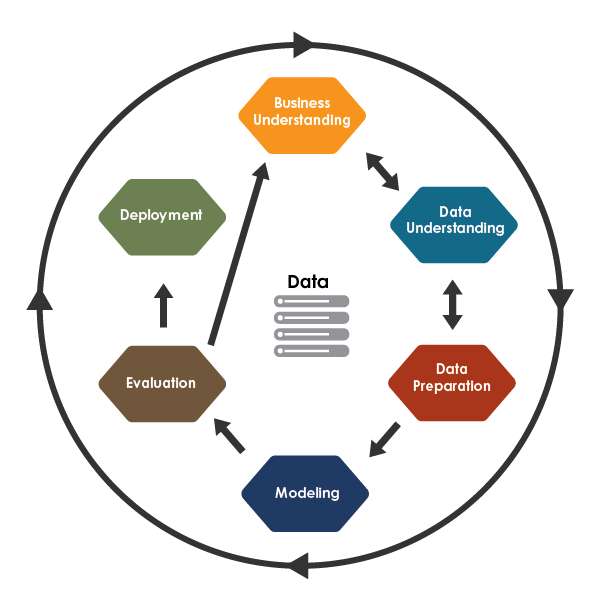
Since such processes do not take into account the lifecycle and operationalization of the ML algorithms. Processes such as Microsoft TDSP combines modern day agile practices with a structure nearly similar to Crisp-DM. Below diagram explains the Microsoft TDSP process.
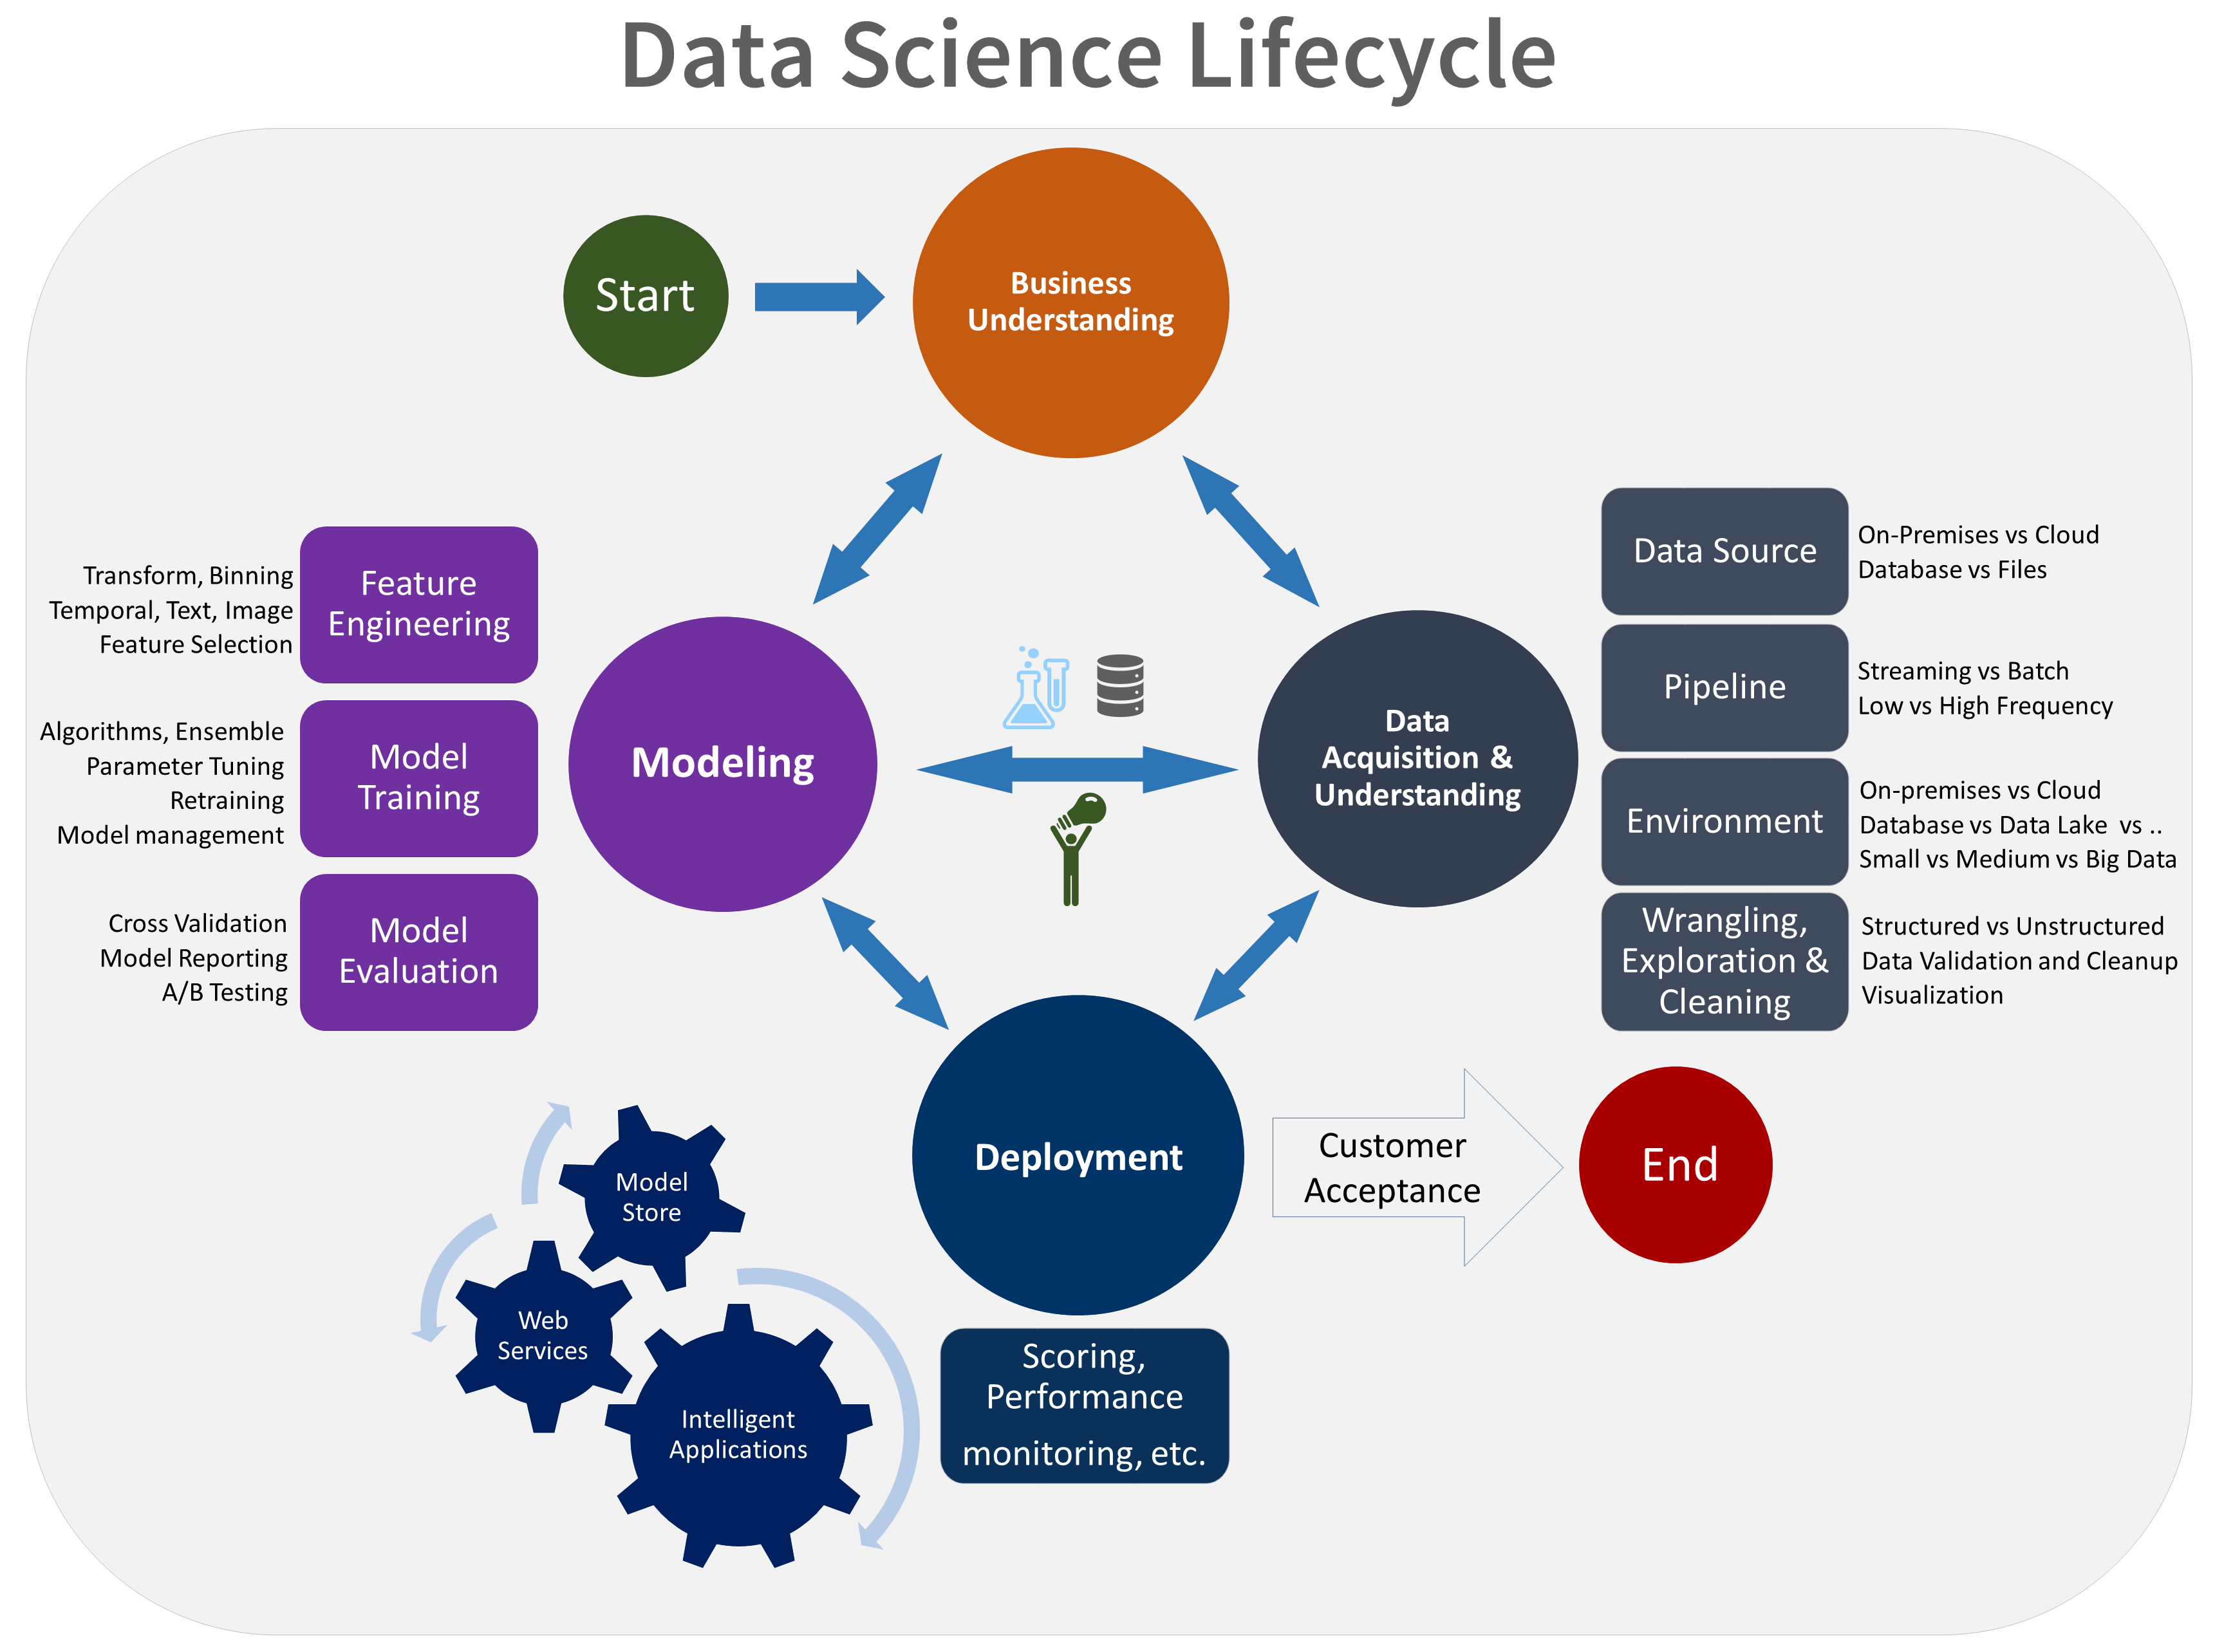
The next question is - who are the stakeholders in data analytics process? Guess what - it is not just the data analytics team on the front end. Data Analytics is a result of so many ingredients - data strategy (to select the right data source), infrastructure for analytics (right technology to host data and perform analysis), data engineering (engineers creating pipelines to help generate the clean data assets for data analytics team) and then finally the analytics professionals to generate insights from data. Each stakeholder in the process is really important and a right mix of these teams is often necessary for a successful analytics process. Think of it this way - the actors working in films might be the face of the films but the technicians, directors, writers and musicians have to do it right to make a good film. By the way - in no way I am saying the data analysts are in lead roles but it was just an analogy to describe how all the process are equally significant.
Kühn et al. (2018) define analytics canvas - a framework for design and specification of data analytics projects. They have provided the below diagram as the 4-layered canvas for analytics.

Section 3: Phases of Analytics Projects
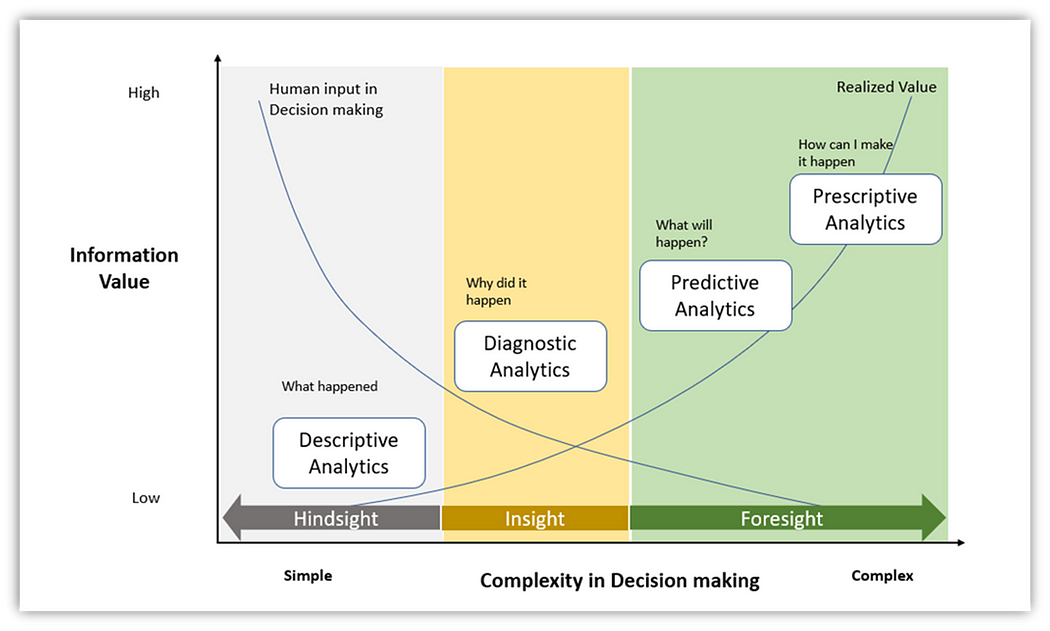
Do you know which is the most significant phase of analytics ever done? It is exploratory analysis - meaning the analysis done to identify the trends in data. This is the most underrated part of analytics as it does not involve any fancy data modelling - however, it is really significant to decide on the future course of action. There are 4 typical phases of data analytics project. In other words, there are 4 types of data analytics projects.
- Descriptive Analysis - "what happened in the past"
- Diagnostic Analysis - "analysis to find out why"
- Predictive Analysis - "what will happen"
- Prescriptive Analysis - "what should you do to enhance the outcome for you"
Gartner's Analytics Maturity Model defines these 4 phases in terms of information value v/s complexity in decision making.
If a full lifecycle project is under the scope, i.e., if all the 4 phases of analytics maturity model are under consideration in one project, there is a common framework - known as double diamond for data analysis which can be employed. See the diagram below from Roger Peng.
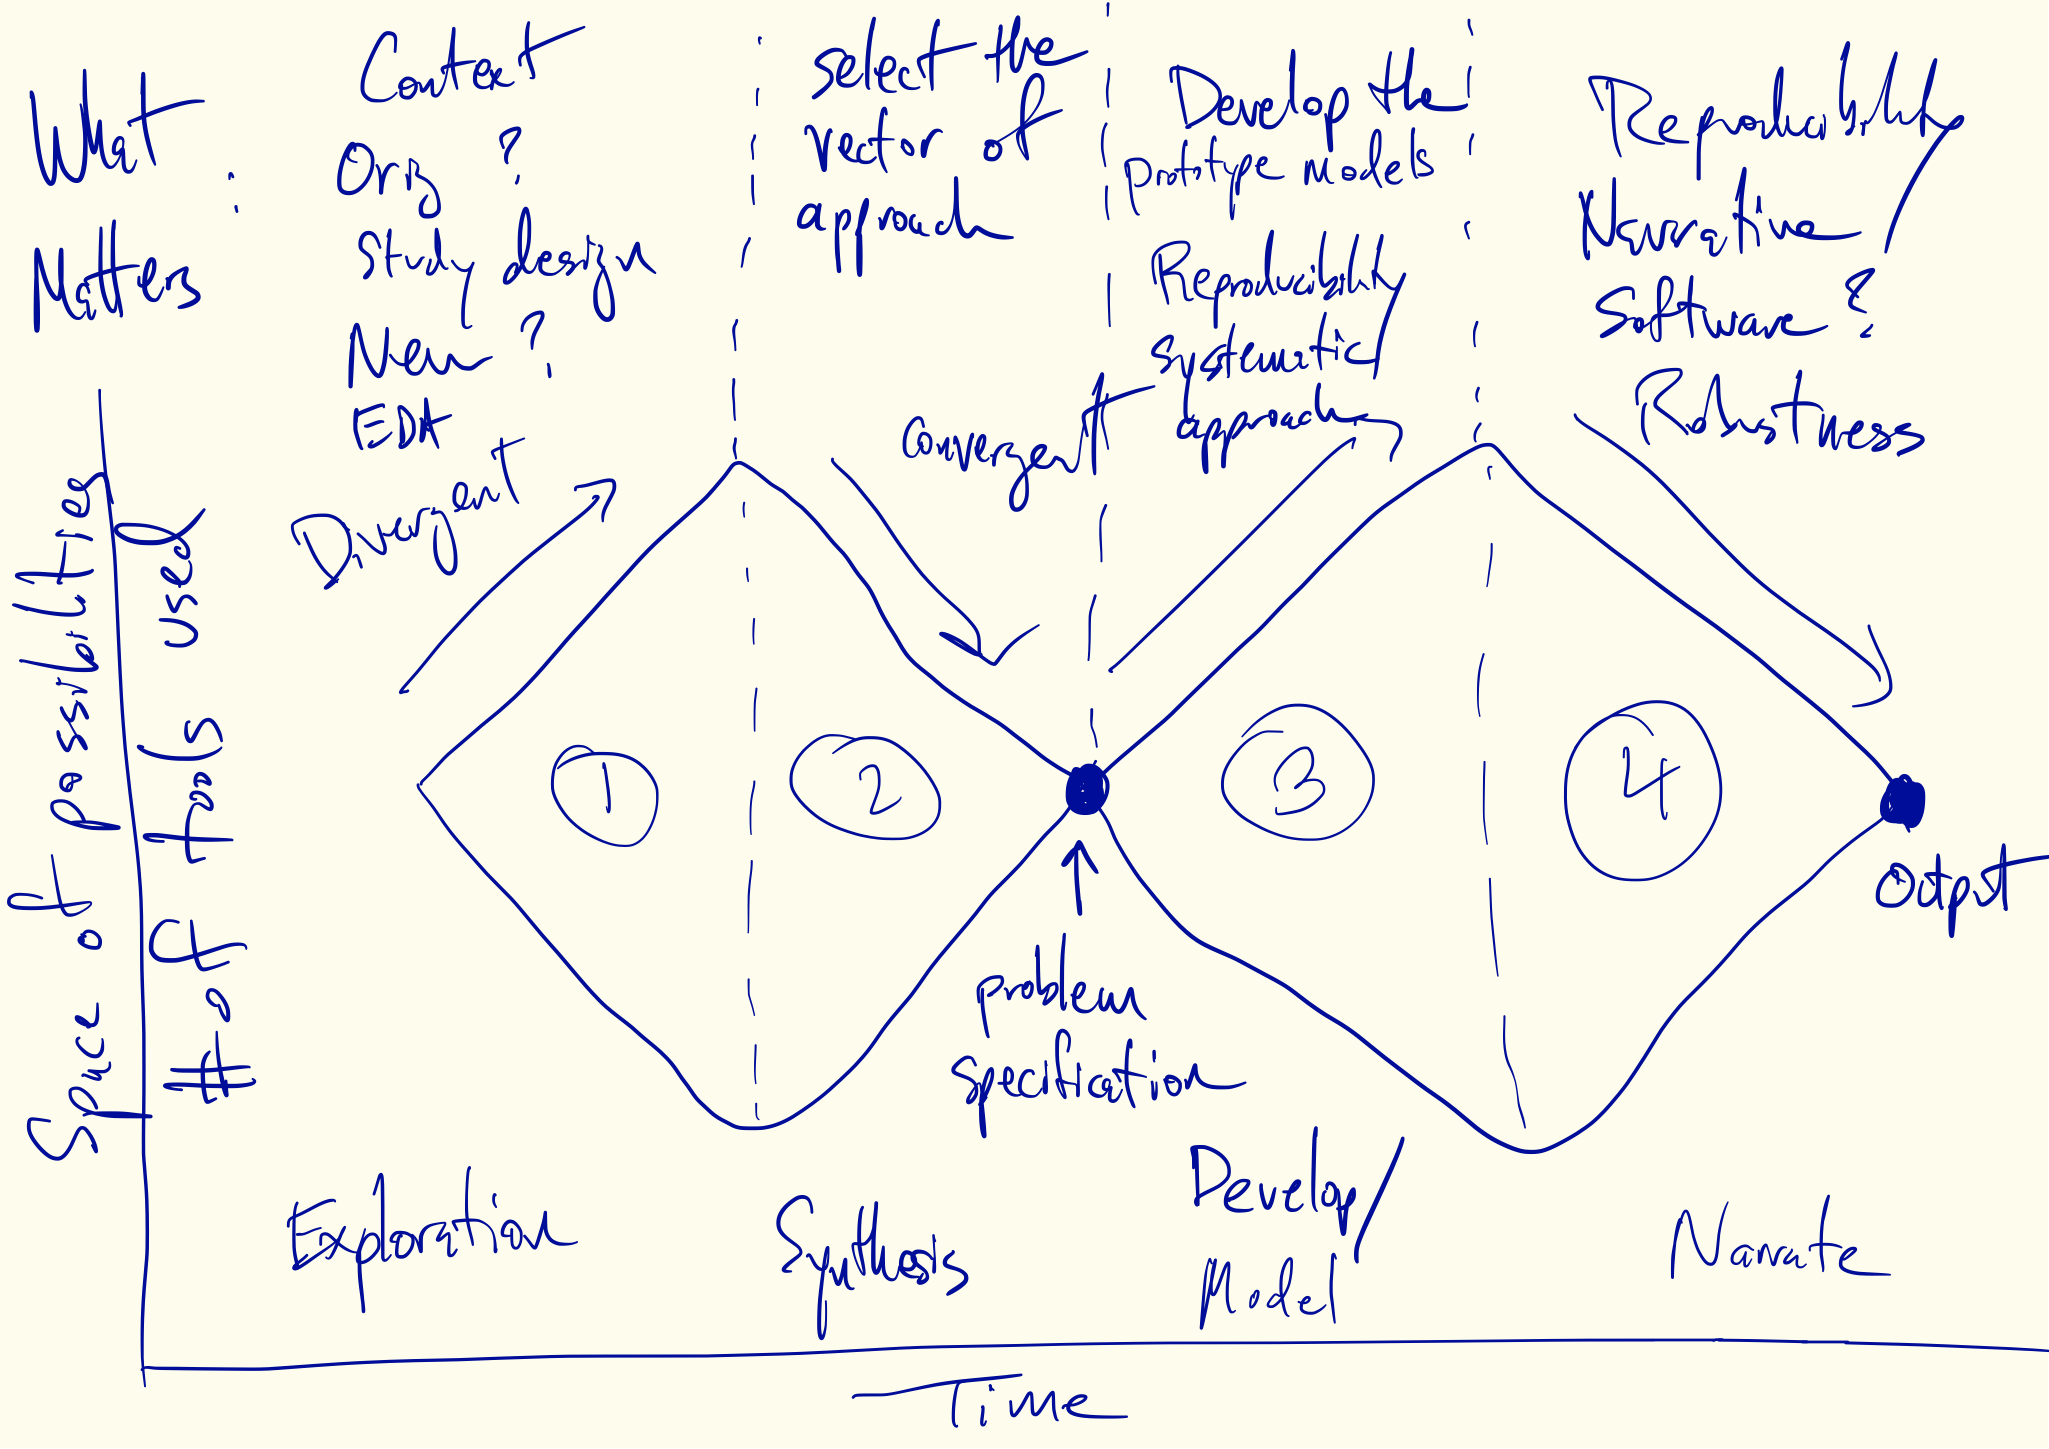
Phase 1: Exploration – divergent phase
Phase 2: Refining the problem – convergent phase
Phase 3: Model development – divergent phase
Phase 4: Narration – convergent phase
Section 4: Organizational mindset
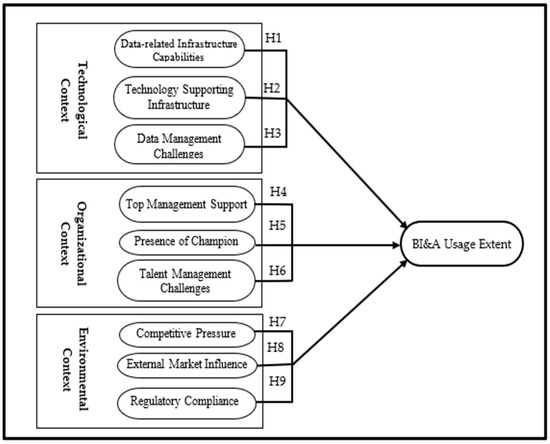
To execute successful analytics at enterprise level, it is not just important to hire skilled analysts. It is much more that that! In fact, to explain this in a better way, Mohammad et al. (2022) try to understand what all factors are beneficial to implement a successful Business Intelligence & Analytics function (BI&A function). They perform a statistical analysis to conclude that the following functions have a statistically significant impact on BI&A function:
- Business & Technology Supporting Infrastructure
- Advanced IT infrastructure
- Support of Senior Management
- Competitive pressure (since company X is adopting this, why should we left behind?)
- External factors
This is just provided as an example to show that a successful analytics function is a product of so many front end and backend factors.
Section 5: Failures in Analytics Projects
Often, in statistical analysis projects, p-values are considered god. In regression, classification, clustering, factor analysis, etc., p-values are considered to be the go-to source for identifying which parameters to discard, and which ones to keep.
Even in various scientific applications including clinical analysis, p-values often dictate the incorrect hypothesis acceptance and lead to ambiguous interpretations. Winkens & Akker (2011) argue that medical research will not enhance itself if the results are interpreted simply between statistical significance v/s insignificance. Its more nuanced than that. In fact, they argue that confidence intervals hold more value than simple p-values.
Gorard (2016) also emphasize the importance of designing better studies and questions and not just relying simply on statistical inferences.
Roger Peng, in his article, Thinking About Failure in Data Analysis, explain that there are two types of failures in data analysis projects: Verification failure & Validation Failure.
- Verification Failure - a failure where things don't add up. If, for example, you are trying to find correlation between two variables, and it comes out to be way to different than expected, it is a verification failure.
- Validation Failure - broader class of failure which is due to the poor design of the problem statement, requirements and incorrect methodology used for solving the problem.
Roger also focusses on the fact that in order to reduce the chances of failures across analytics projects, best way is to collate experiences from multiple analytics professionals to ideate and brainstorm on the problem statements, methods used, outcomes and potential ways to reduce the chances for failures.
Conclusion
The focus of this article was to shed light on the organizational aspect of analytics function. Analytics is often represented as a front end data manipulation through fancy tools and algorithms, however, it is an amalgamation of so many different aspects (some on the backend) and most importantly, the mindset of the leaders. Also, analytics should be considered as a process rather than an outcome. If right problems are solved through right methodologies, there is a high chance that the outcome of the project will be positive.
References

https://www.sciencedirect.com/science/article/pii/S2212827118301549
https://medium.com/@milind.bapuji.desai/understanding-the-analytics-maturity-model-84982836b107


https://www.tandfonline.com/doi/full/10.3109/13814788.2011.618222
https://simplystatistics.org/posts/2021-11-10-thinking-about-failure-in-data-analysis/
https://journals.sagepub.com/doi/abs/10.5153/sro.3857


