Databricks AI/BI Genie - how good of a Genie it is?

With AI penetrating the analytics industry, maturity of solutions across different analytics lifecycle varies. Amongst different analytics areas, exploratory data analysis or EDA is relatively an easier space for AI to mature in the next few years. Companies across all industries have been trying out solutions to automate this relatively easier, yet "complex to scale" part of analytics. In my experience and view, there has been a lot of development in terms of proof of concepts, upskilling employees, and educating business on these AI automation solutions, however, the measurement of value and ROI is something that is yet to be defined.
For example, some of the value measurement parameters of AI are:
- Have we been able to remove human in the loop?
- Is there a reduction in size of the analytics teams - BI analysts, data engineers, ML specialists?
- Is there a reduction in cost to generate insights?
- Is there a reduction in time to generate insights?
Value realization for AI will be a hot topic for companies towards end of the decade. But one thing is for sure - things are moving at fast pace and the major platform based companies including AWS, Databricks, Google are scaling their platforms to embed AI as part of their solutions. One good example is Databricks - they have scaled their platform to include AI/BI Genie - which is tool to enable interaction of business with the data through Natural Language.
What is AI/BI Genie?
AI/BI genie in Databricks allows data professionals or the business stakeholders to easily train the space with the organization's data, and then interact with the data in plain English or other languages. In an underlying sense, it converts the language into SQL/python code and provides the code as well as the response as an output. In this blog, I aim to assess this tool through an interesting use case. I thought that solving a use case is a better representation of the functionality and maturity of the platform.
Introduction to the use case
To test Genie, I have tried a relatively simpler but yet very interesting use case on Geopolitics. I have consolidated multiple datasets and metrics at country level to create a master set for the analysis, source for this data includes Kaggle, World Bank, Gallup and World Population Review. World population review has numerous datasets with KPIs at state/country level that indicates the performance of the state including population, GDP, health, military and travel.
For this use cases, I have incorporated the following metrics:
| Metric/KPI | Source | Definition |
|---|---|---|
| Continent | Kaggle | One of the 7 continents where the country resides |
| HumanDevelopmentIndex_2023 | Kaggle | A summary composite measure published by the United Nations Development Programme (UNDP) that ranks countries' average achievements in three basic dimensions of human development: a long and healthy life, knowledge, and a decent standard of living. |
| Debt to GDP ratio | World population review | A metric that compares a country's total public debt to its annual economic output (Gross Domestic Product) to reliably indicate its ability to pay back its debts. |
| Arable Land by acres | World population review | The amount of land area (measured in acres, though commonly reported in hectares) that is suitable for cultivation and the growing of temporary crops, meadows, or market gardens. |
| Lat | Kaggle | Latitude of the country |
| Long | Kaggle | Longitude of the country |
| Latest Rank - Happiness | Gallup | A country's position in a periodic report (commonly the World Happiness Report which uses data from the Gallup World Poll) that ranks national happiness based on subjective well-being and other contributing factors. |
| GDP per capita | World population review | A comprehensive measure of the average income per person in a given area, calculated as the total gross domestic product divided by the population. |
| % Military spending of GDP | World Bank | The percentage of a country's total Gross Domestic Product that is allocated to military expenditures in a given year. |
Lets train Genie together
Training a Genie space is pretty straightforward. Let me list down the steps one by one.
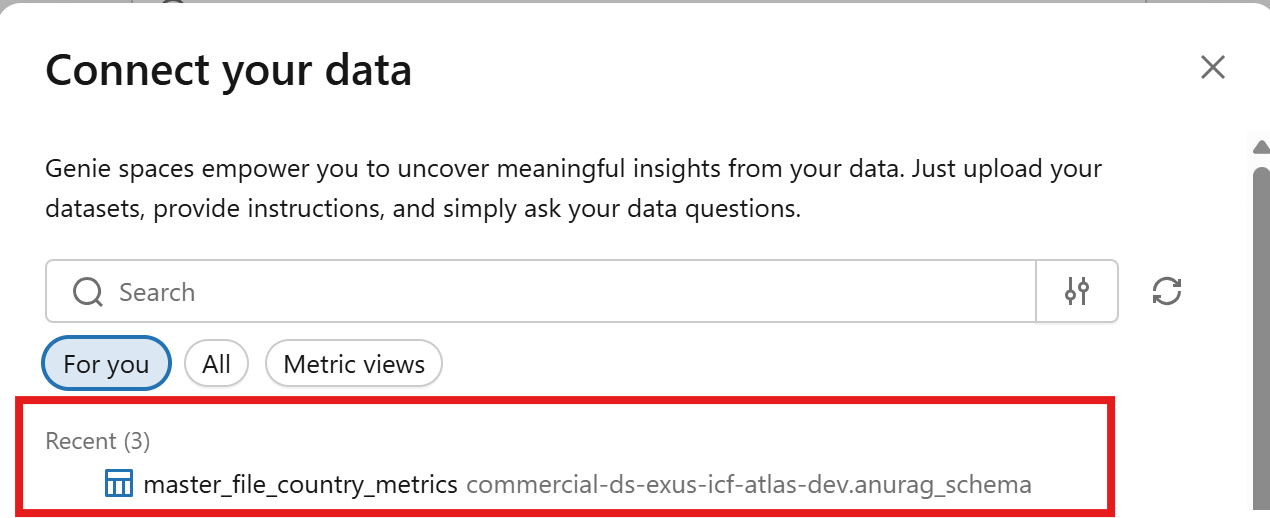
Step 1 - Load your data in your unity catalogue. Anything in unity catalogue can be loaded on the Genie space.
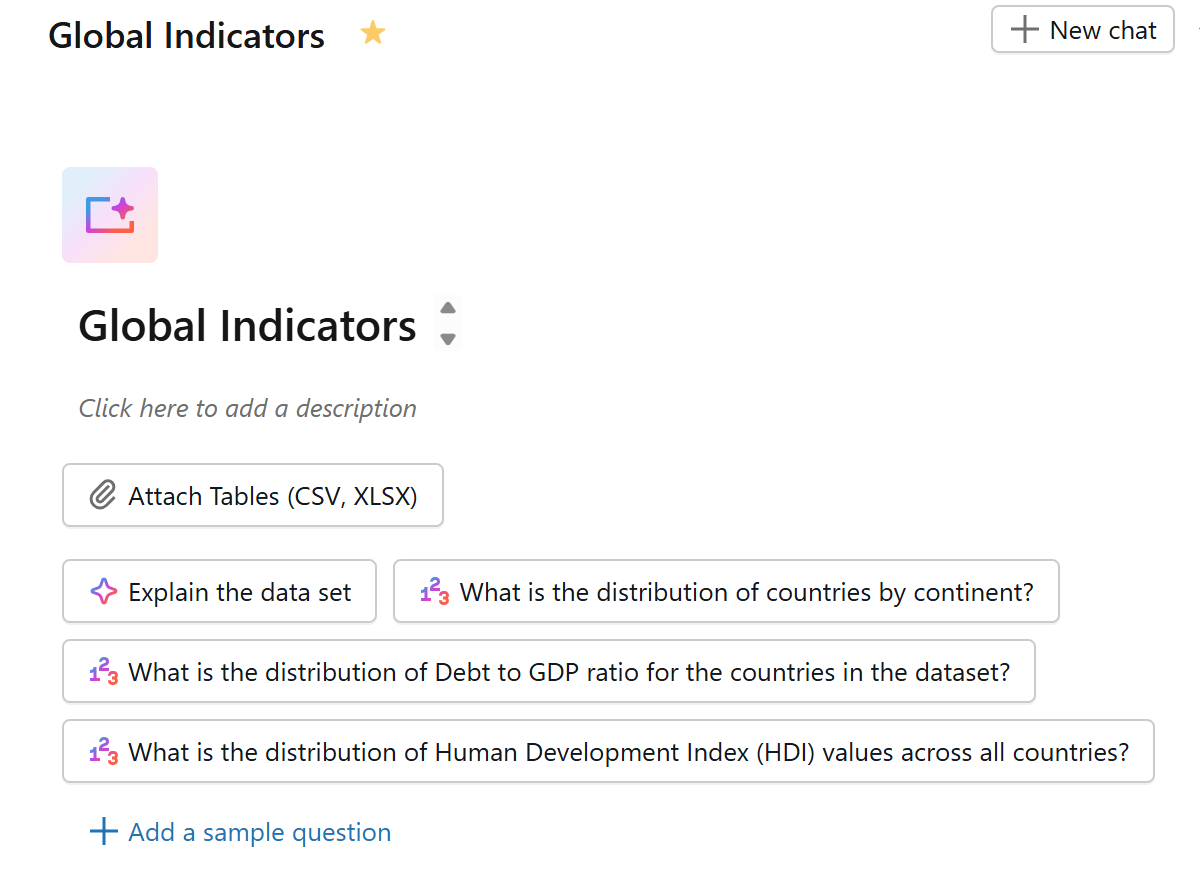
Step 2 - Create a genie space and select the dataset that you want to load onto your space.
Step 3 - you are practically ready to train and ask the questions from this Genie space through Natural Language Query.
Step 4 - training the Genie space. To train a Genie space, you can either:
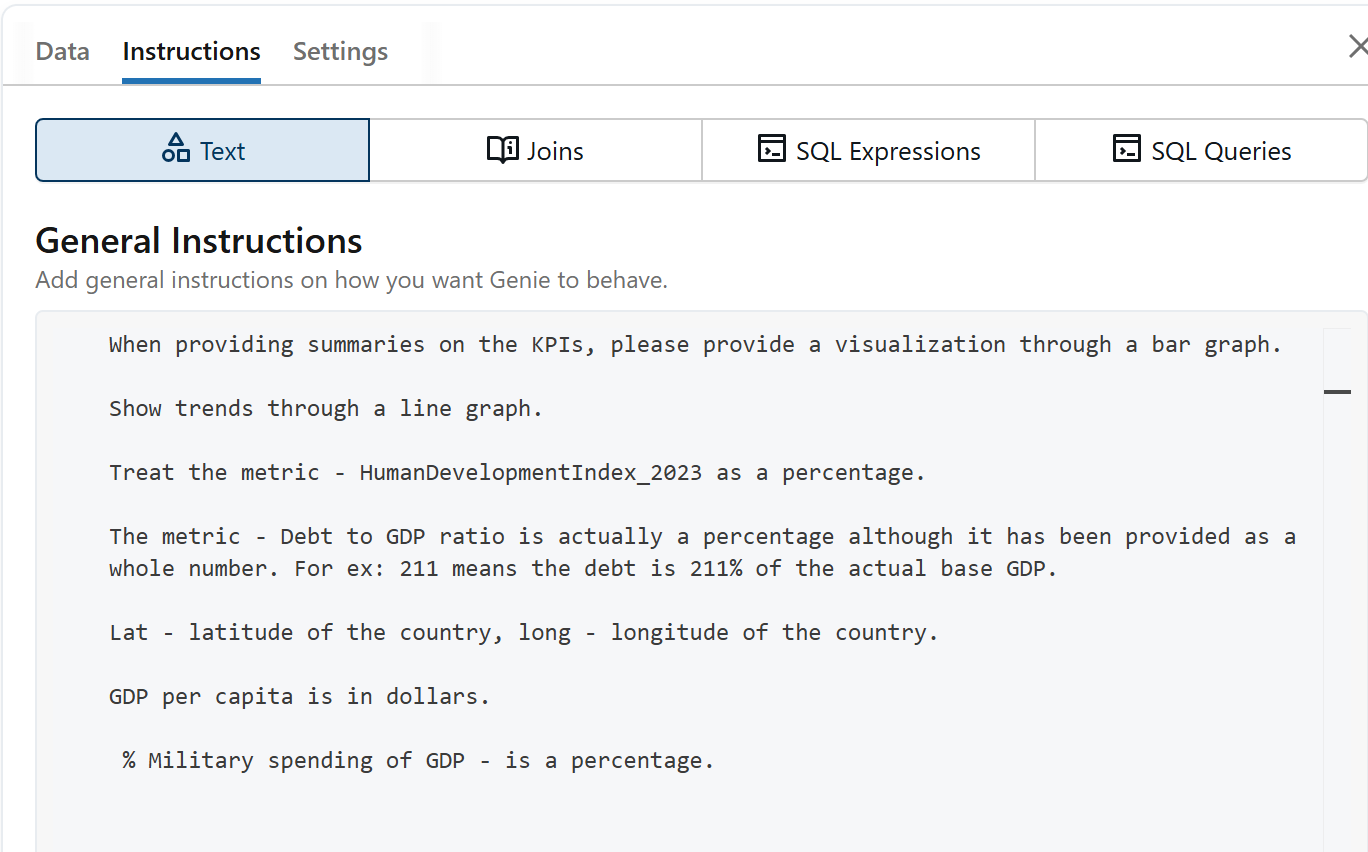
A. train the bot in simple English language through Text tab on instructions.
B. Join - you can join your table with multiple other tables through a logic.
C. SQL Expressions - you can provide synonyms, filtering logic and dimension logics
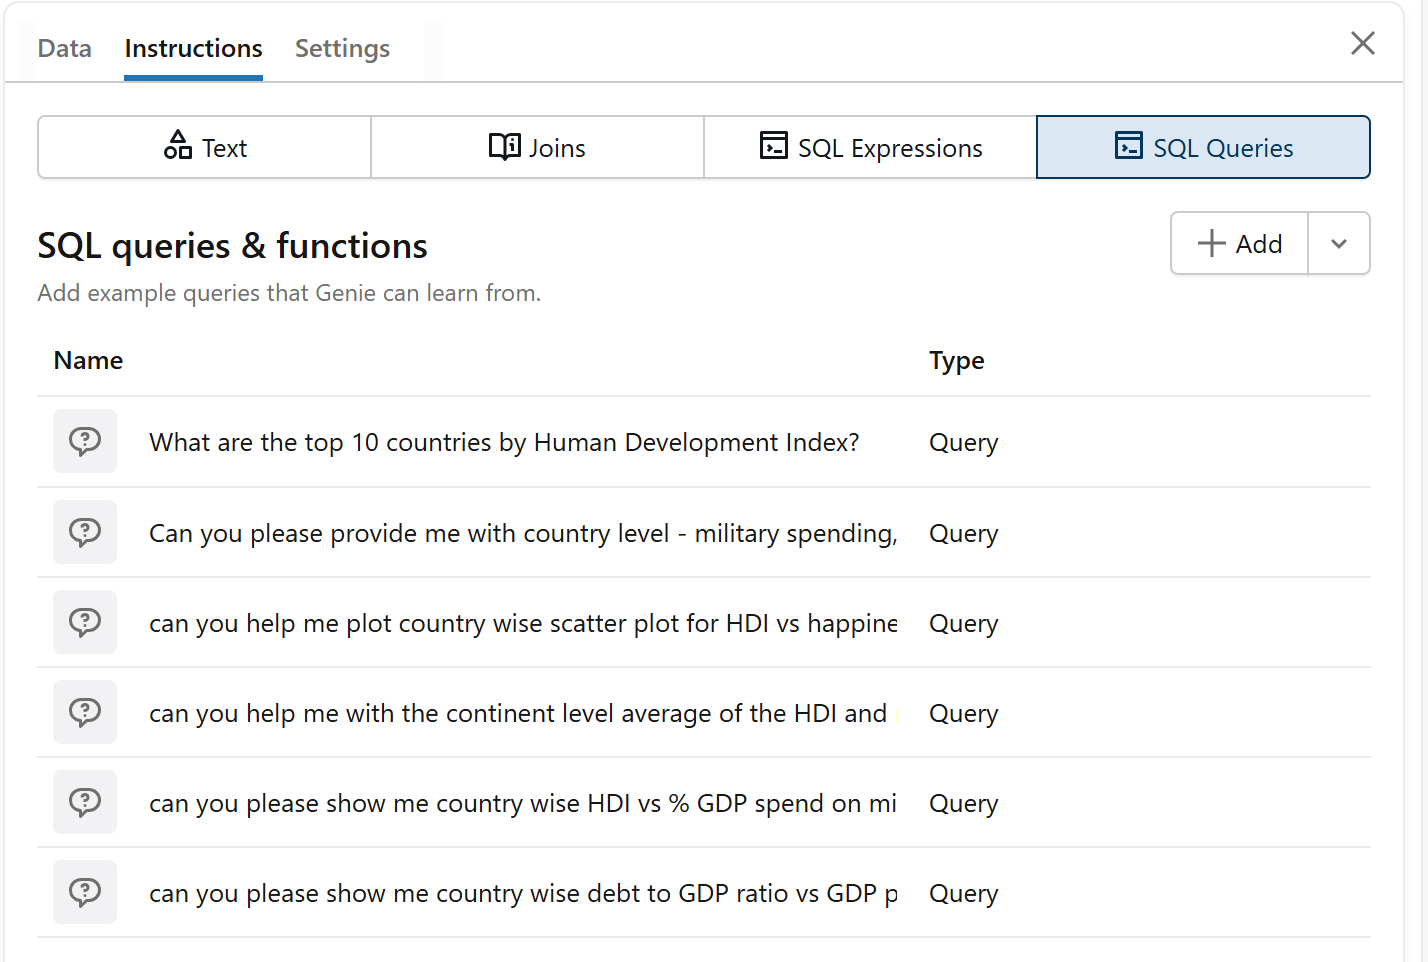
D. SQL queries and functions - provide sample questions and the respective queries so Genie knows how to respond to similar questions.
I did not train the bot prior to asking the questions. As I learnt about the bot's flaws and understood its functionality, I started to provide instructions through simple English as well as SQL expressions.
Sample Questions and Insights from Genie - performance evaluation
Below I briefly list down some of the key business questions I asked and how Genie responded.
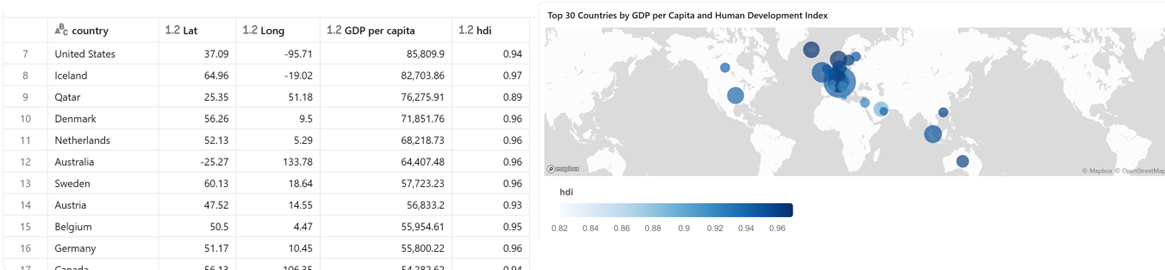
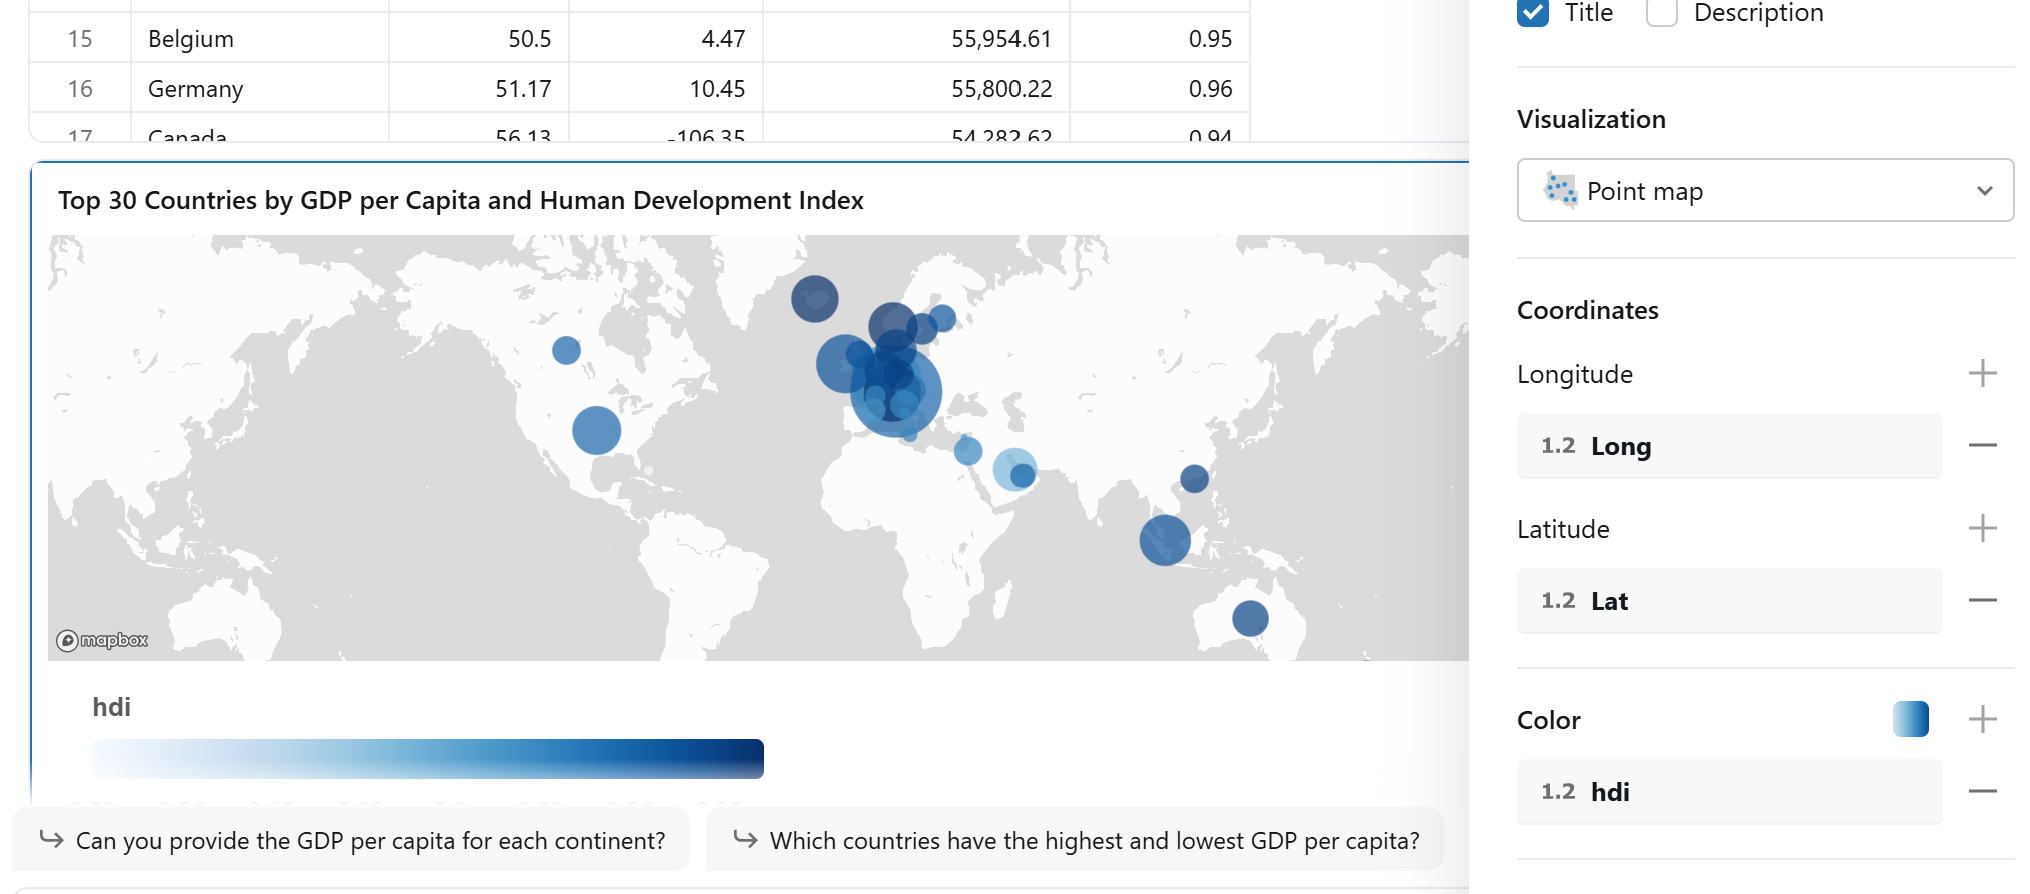
Question - can you show me top 30 countries on a map by GDP per capita and human development index?
Genie's response:
Genie also provides an option to provide feedback to its answers - and you can select the options of feedback or provide feedback through open text field.

For each question, it typically provides a tabular response and a visual. In my experience, the visual is often what you do not expect and you would like to change. For ex: the map visual is not something that Genie provided as default, I had to edit the visual and retrain Genie on multiple occasions to obtain this response. As shown in the visual below, I can edit a chart and choose different visualization, change the x/y axis and add colours, heat or size.
Let me show you some of the other responses – lets derive some cool insights from the data now.
Countries at fiscal risk
Amongst the countries with high debt, Mozambique, Eritrea, Sudan, Lebanon, Bhutan, Sri Lanka and Argentina have very low GDP per capita.
There are some countries however, which have high debt, but very high GDP per capita - Belgium, Canada, US and Singapore.
Special mention - Japan apparently has amongst the highest Debt to GDP ratio (2.55) among the developed countries indicating very high debt largely due to prolonged stimulus spending, an aging population requiring high social security costs
High-Income but High-Debt Paradox: Advanced economies like the U.S. and Canada carry high debt relative to output but leverage robust GDP per capita and deep capital markets to sustain growth and creditworthiness.
Vulnerable countries - very high military spending
I wanted to analyse the countries which spend the highest proportion of their GDP on military, and also delve into their GDP per capita - if they are able to sustain their population with a decent standard of living.
Top countries which highest military spending are Ukraine, Eritrea, Libya, Lebanon, Algeria, Saudi Arabia, Qatar and Russia. Most of these countries are ridden with a direct or indirect conflict with other countries. Amongst these countries, Libya, Lebanon and Ukraine have very low GDP per capita indicating lower standard of living.
Apart from GDP per capita, Human Development Index (HDI) is another reliable metric to indicate the country's development. Below is a visualization which shows two metrics on the same visual - % military spending of GDP & HDI. HDI is shown through the heat (red to green -> read ones being low HDI), and the size of bubble shows the military spending.
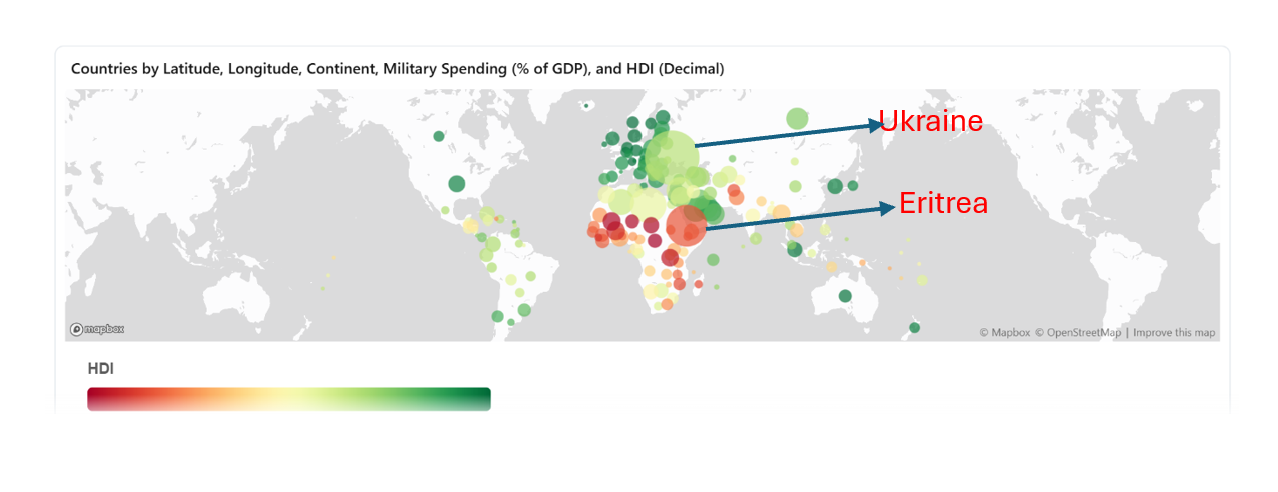
It is very evident that most of the African countries have low HDI and European and North American countries have very high HDI.
In fact, rising global military spending now tops $2.7 trillion, crowding out development investment; UNDP warns this trend particularly squeezes health and education funding in low- and middle-income countries.
Confirming the hypothesis - does high HDI lead to happiness?
I asked Genie - can you please help me understand the correlation between happiness rank and HDI?
The visual showcases that on average, better (lower) the happiness rank, better the HDI of the country. All the Nordic countries have very high HDI and very high happiness ranking.
Note - although the metrics are correlated, but the primary rule of correlation is that correlation does not mean causation. Recent findings show happiness is less about GDP growth and more about stability — access to healthcare, education, and social support (core HDI pillars) explain why high-HDI nations remain happier even during global economic slowdowns.
National food security analysis
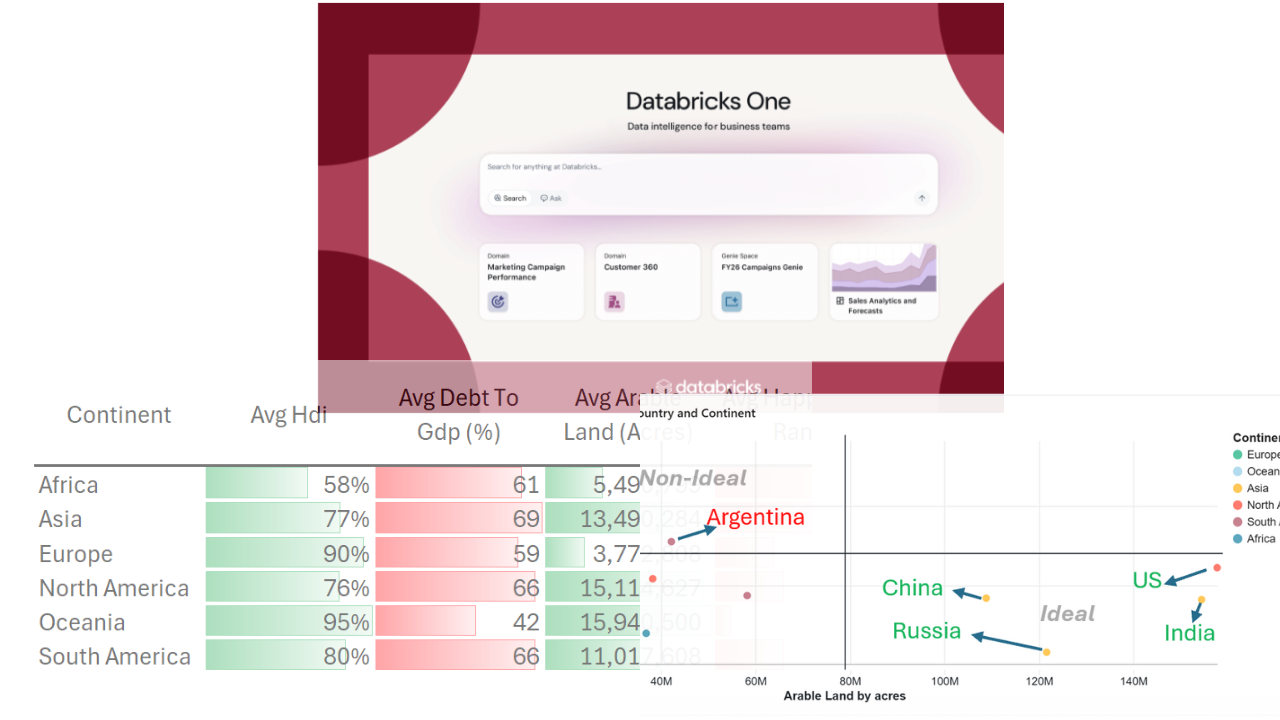
One of the extracted geopolitical metric is % arable land indicating a country's abundance of resource for crop and food production. Higher value is better, but some countries are luckier than the others in this regard. I wanted to understand the relation between debt to GDP ratio vs arable land. Below are the results. China, Russia, India and US are all in one cluster (quadrant 4) indicating low debt and high abundance of arable land, whereas, Japan and Argentina is in the non-ideal cluster of high debt and low arable land.
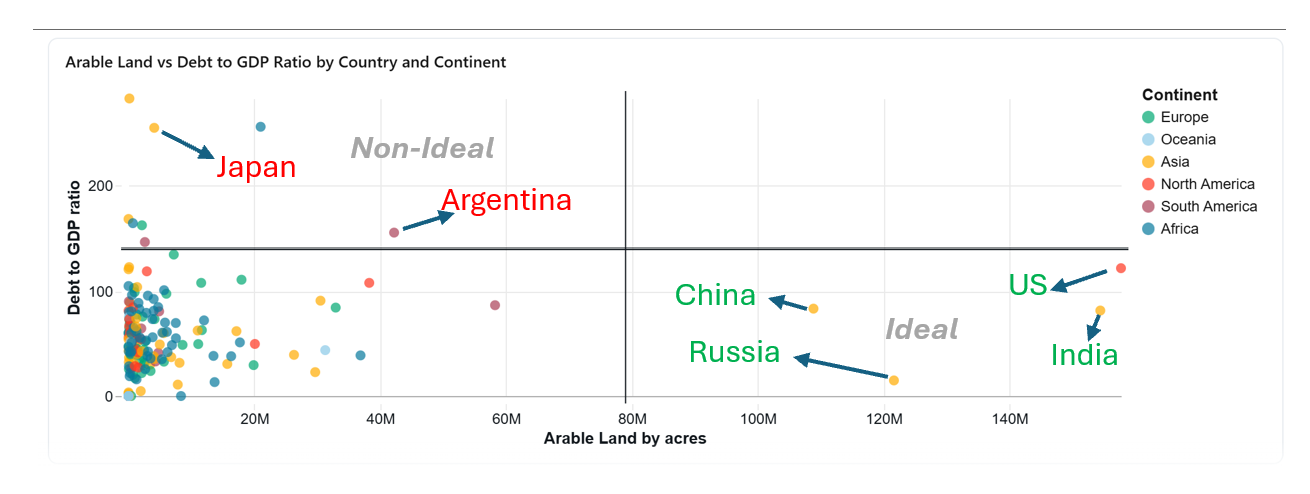
India and China's position reflects a quiet strength —their large arable base underpins food self-sufficiency policies that shield it from global commodity shocks.
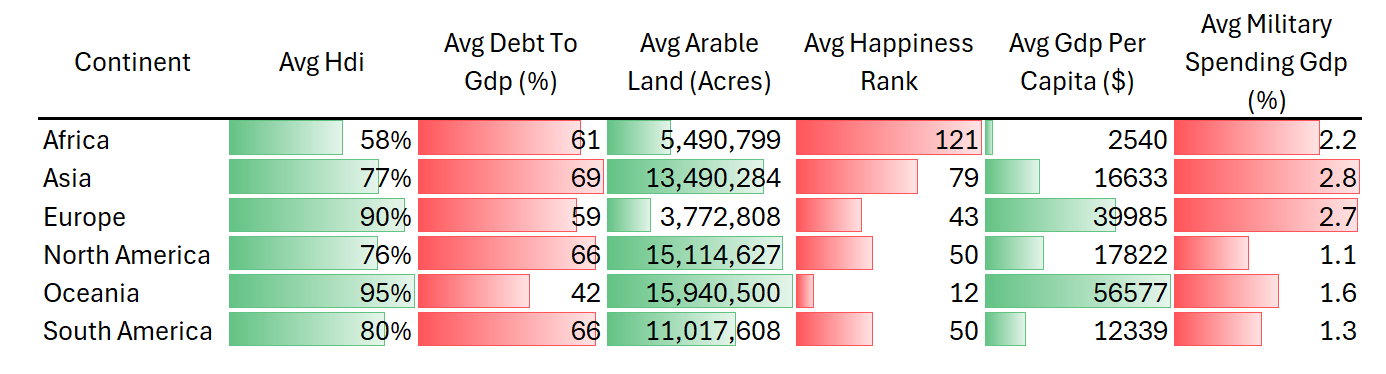
Last but not the least: continent averages
Below is the result from Genie (I downloaded the answer and formatted in excel):
Strengths and weakness of the tool
Assessment of a GenBI tool on strategic parameters is a very broad topic in itself so I would not assess Genie on those parameters as part of this blog. However, I would like to share some quick insights at high-level based on my experience:
Strengths:
Integration: easier data ingestion in unity catalogue, and ease of data integration with the tool. It is amazing how this capability has also been incorporated as part of Databricks AI/BI dashboards too.
Ease of use: I would rate this metric for Genie as pretty high. Provision of instructions, asking questions, providing feedback and re-training Genie is pretty simple.
Time to insights: Once we load the starter warehouse, the time to insights is pretty low as compared to some of the other tools
Weaknesses:
Training - the English instructions section is not too mature and does not lead to increase in performance. SQL queries are more impactful vs the English instructions.
Limited visualizations: Databricks only provides 4-5 different visualizations in the outputs, and this limits the analysis we can do. Although we can also edit the visuals, but there are very limited functionalities in terms of transforming the visuals.
User Interface: Databricks only recently launched the Databricks One platform for business users through which business users can access and leverage AI/BI dashboards and Genie spaces, but it is a bit non-competitive and not too impressive.
Assessing GenBI is relatively broad and complex topic and I plan to keep writing in order to assess other similar tools, compare competitive solutions and generate strategic parameters which should provide us a thumb of rule while working on these solutions. As a general rule of thumb, despite the tool, the level of backend training on these tools makes them customized to our use cases and stakeholders, which in turn helps us create a more reliable platform for analytics.
If you find my content useful, please subscribe to my website 😃
References